Bullish continuation chart patterns you need to know
Bullish Continuation Chart Patterns You Need to Know
Introduction
In fast-moving markets, traders look for setups that ride the trend rather than fight it. Bullish continuation patterns are like the green light after a pullback—signaling the uptrend is back on. This piece drops practical patterns you’ll actually see on charts, how they behave in different assets, and what to watch for in the evolving prop-trading world, from DeFi to AI-driven tools.
Popular bullish continuation patterns
Bullish Flag
- What it looks like: A sharp price run-up (the flagpole) followed by a small, parallel pullback that forms a rectangular flag. The consolidation tilts slightly or remains flat, then breaks out in the same direction as the prior move.
- How to trade it: Wait for a breakout above the flag’s upper boundary with stubborn volume. Target is often the flagpole height added to the breakout level.
- Real-world cue: You’ll often see noisy intraday action calm into a clean channel after a rally in tech stocks or a dollar move in FX.
Bullish Pennant
- What it looks like: Like a flag’s cousin, but the consolidation forms a small symmetrical triangle, with converging trendlines right after a big leg up.
- How to trade it: Breakouts above the pennant’s upper line with volume confirmation tend to lead to a continuation move. Measure the height of the initial leg to project a target.
- Real-world cue: Quiet pullbacks after a strong earnings run or a favorable macro print can set up this compact pattern nicely.
Ascending Triangle
- What it looks like: A flat top resistance with rising support, creating a bias that bulls are tightening the range.
- How to trade it: A breakout above the horizontal resistance, ideally with rising volume, often signals momentum returning to the uptrend. Target roughly equals the height of the triangle added to the breakout point.
- Real-world cue: In indices or ETF charts, an improving macro backdrop can push the breakout through resistance with conviction.
Cup and Handle
- What it looks like: A rounded bottom (the cup) followed by a shallow pullback (the handle) and a breakout to new highs.
- How to trade it: Enter on a breakout above the handle’s high, with volume confirming the move. The measured move comes from the cup’s depth.
- Real-world cue: This pattern works well after gradual recoveries in commodities or cyclicals that have paused after a run.
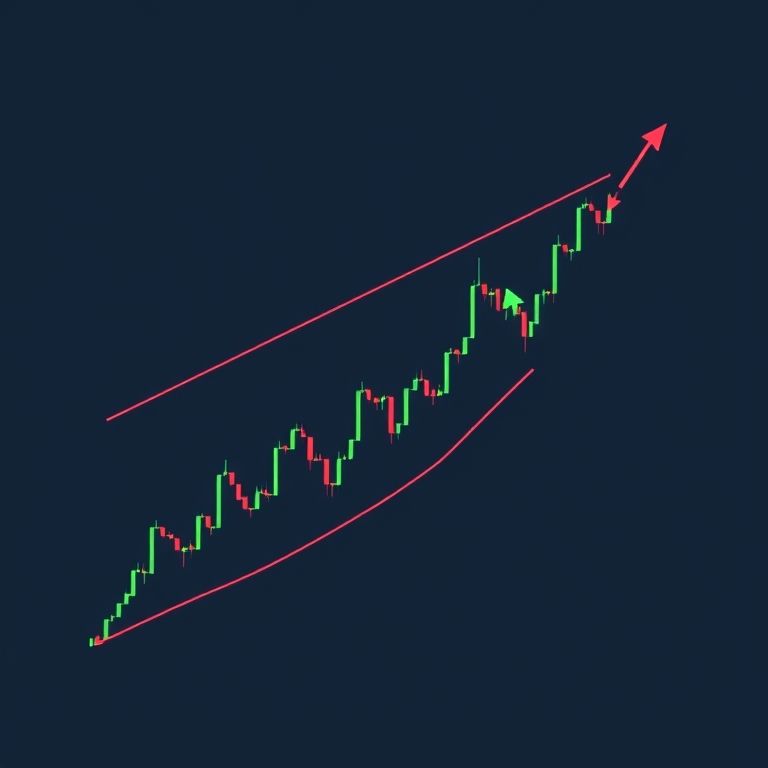
Rectangles and Channels
- What they look like: Consolidation with parallel support and resistance lines, inclined like a shallow upward channel in a bullish context.
- How to trade it: Breakouts above the resistance line with solid volume usually push prices higher. Targets are often the height of the rectangle added to the breakout point.
- Real-world cue: Multi-asset risk-on environments—forex majors, broad stock indices, or crypto markets—often show these cleanly.
Cross-asset applicability and practical notes
- Across assets: Forex, equities, crypto, indices, options, and commodities all display these patterns. In fast-moving sectors, intraday charts may show flags and pennants that resolve in a few sessions, while larger-timeframe patterns provide bigger targets.
- Volume matters: A breakout with weak volume is a red flag; look for volume spikes or expanding range to confirm the move.
- Trade management: Use a stop just beyond the opposite side of the pattern or a percentage-based stop to avoid being whipsawed in choppy sessions.
DeFi, smart contracts, and AI-driven trading
- DeFi realities: Decentralized exchanges and liquidity pools create fresh charting signals, but volatility and protocol risk can complicate clean pattern interpretation. Stay mindful of on-chain events and governance changes.
- AI and automation: AI-based scanners speed up pattern recognition, but human judgment remains key for context, risk controls, and timing of entries/exits. Smart-contract trading and bots are powerful when paired with robust risk management.
Prop trading outlook and trend resilience
Prop desks prize repeatable edges. Bullish continuation patterns offer scalable setups across timeframes, especially when combined with disciplined position sizing and a clear risk plan. As capital markets broaden with AI, DeFi, and cross-asset liquidity, these patterns can help signal durable trend continuation—provided you stay patient on breakouts and respect risk limits.
Slogan and takeaway
Ride the wave, not the chop. Bullish continuation patterns are your lighthouse in choppy seas—pattern, confirm, and let the breakout carry the momentum.
Closing thought
If you’re building a learning path, start by charting these patterns on a demo across a few assets this week. You’ll notice the same rhythm—pullback, compress, breakout—repeating with different flavors. That rhythm is where you translate insight into consistent edge.
YOU MAY ALSO LIKE